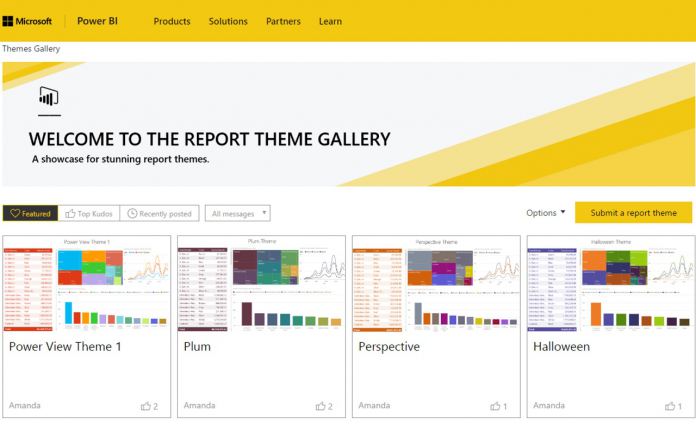
Report theming is a new preview feature in the Power BI Desktop which lets users pick colors to use in their charts and to show in the color palette. With report theming, users can quickly color their entire report to match a theme or a corporate branding. When a user imports a theme, all their charts will automatically update to use the theme colors, and they will have access to the theme colors from the color palette. Users can upload a new theme file using the Import Theme option under the Switch Theme button.
Download or create your own theme
Thanks to the introduction of the Report Theme Gallery, users of Power BI can now find ready-to-use themes and add them to their reports. Users will be able to download any theme they like and import it to their reports, as well as make modifications to themes before importing them. The Report Theme Gallery also offers users the ability to submit themes they have created to the theme gallery, for others to see and use. In addition, there is a whole section of the gallery geared towards themes that are more accessible than standard color palettes. Users can find these themes by filtering the list down to Accessible themes. Several themes are already available in the gallery, such as:
Microsoft Microsoft – High Contrast Power View Theme 1 Halloween Plum High Contrast Apex
To access the Report Theme Gallery, click here.


